
Analyzing your employee email engagement is the first step to improving it.
Our easy-to-use Employee Email Analysis Tool will help you visualize your email data, identify trends, and give you simple, data-driven ways to improve your employee emails.
Download the free Excel template, input your email data, and immediately find out:
- Your average email open and click rates.
- How your email engagement compares to industry benchmarks.
- The best time to send your employee emails.
- How subject line length affects engagement.
- Your most effective links and calls-to-action.
Once you've downloaded the tool, follow along with this video and learn how to start analyzing your internal email engagement.
Getting started with the employee email analysis tool
The tool is an Excel template, so you’ll need Excel to use it. Let’s open it up to get started.
Navigating the employee email analysis tool
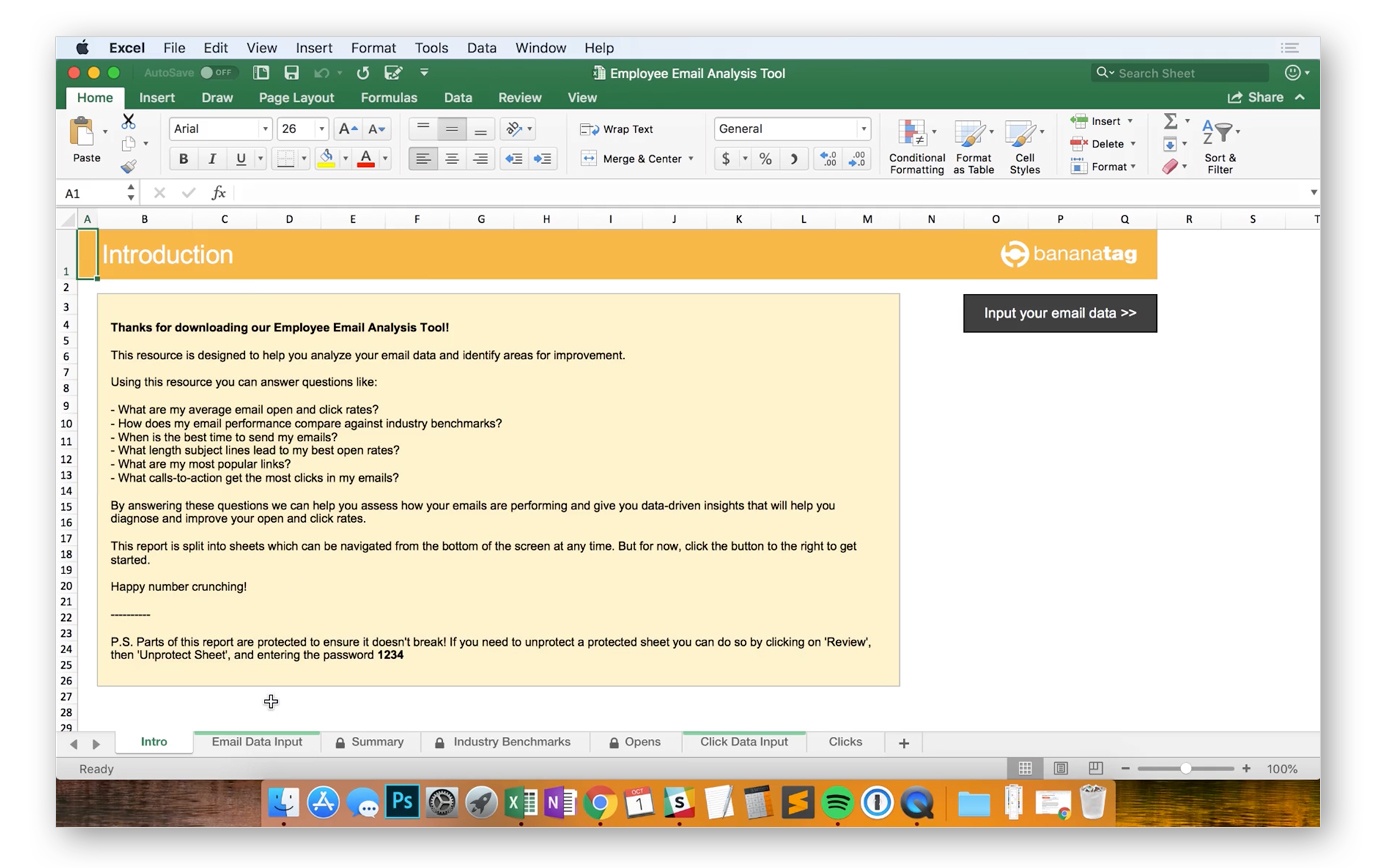
The spreadsheet is split into seven different sheets, which you can navigate from the bottom of the screen.
You can also navigate using the big black buttons on each sheet. These will guide you step-by-step, so it’s best to use them if you’re just starting out.
There are instructions on each sheet that explain what to do and what each section tells you, but I’ll walk you through it so you can get to grips with it more quickly.
Unlocking the employee email analysis tool
Before we start, I’ll point out the P.S. at the bottom here.
Parts of the spreadsheet are password-protected to ensure that nothing breaks. If you do need to unlock anything, you can simply click on Review, Unprotect Sheet, and enter the password 1234.
Inputting your email data in the email analysis tool
Let’s get started by inputting our email data.
As you can see, we have instructions to guide you here, but all we really want to do on this screen is to input our email data.
First, I’ll delete the example data that’s here already.
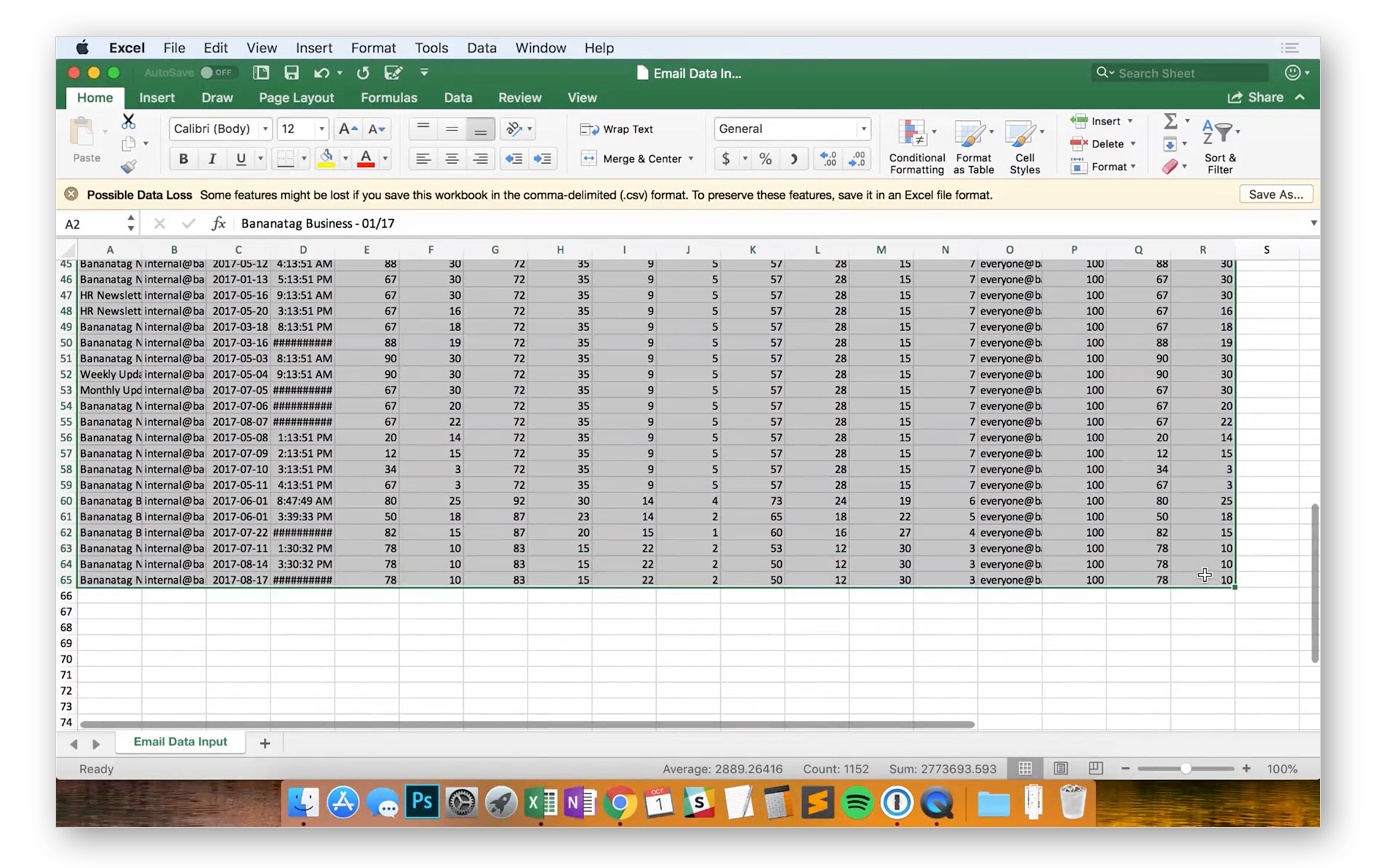
Next, I’ll get the email data I want to use. I exported this CSV file from my Staffbase account earlier, using the “All Stats” report. I’ll select all the data, copy it, then paste it into our analysis tool.
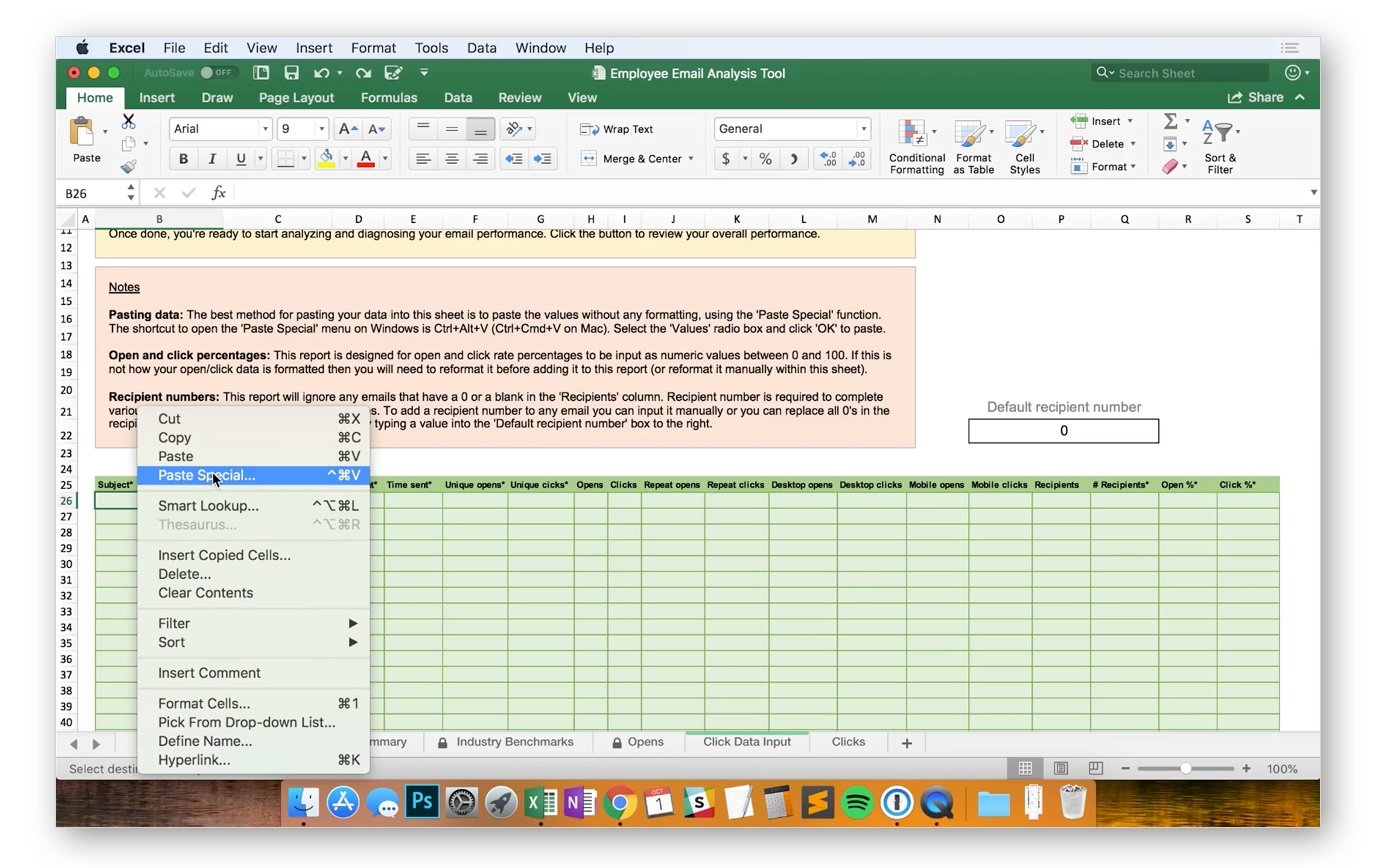
The data should work as it is, but to avoid any weird formatting when you copy and paste, you can also use the Paste Special function to ensure that only the data is copied.
Email data input troubleshooting
If you’re not a Staffbase customer yet, you probably won’t get your data in exactly the same format as we’ve laid it out in this sheet. You may need to do a bit of fiddling and re-formatting to match up with what we see here.
For instance, your email tracking platform may export the open and click rates as decimals rather than numbers ranging from 0–100, or the date format may not be recognized by Excel. You should fix that before proceeding.
You don’t need data for every column, but the really important ones are marked with an asterisk.
This report is designed to analyze your open and click rates. So if you don’t input data for these last three columns, then not everything will work.
By default, the report will ignore any emails where the number of recipients is zero. We need the number of recipients to calculate open and click rates properly.
If you have an email with a “0” or a blank in the number of recipients column, you can input this number manually for each email, or update all zeros in the recipient column en masse by entering a number into the box highlighted in red in the illustration below.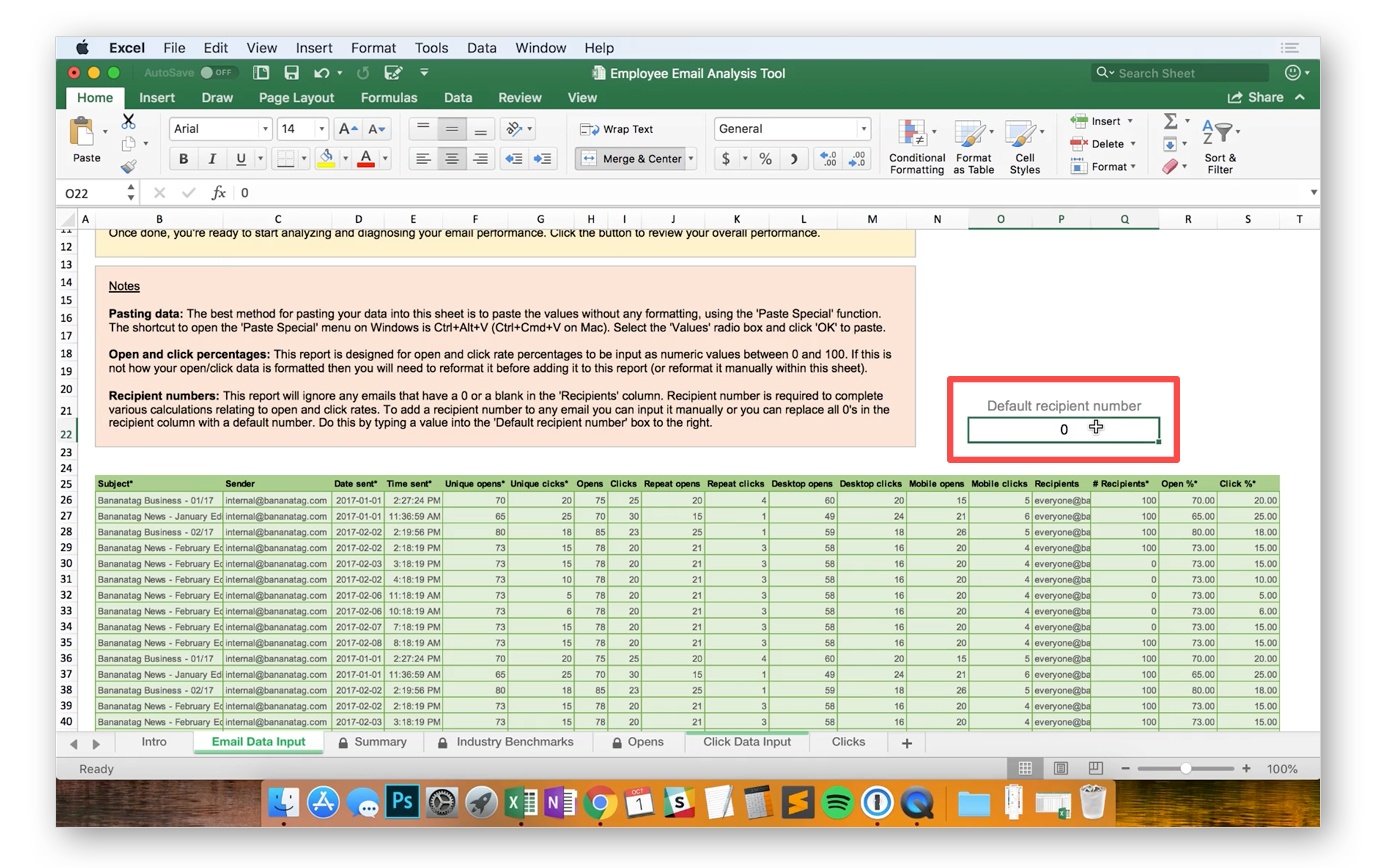
This will be useful if you send to the same distribution list every time. You won’t see this number updated in the table below update, but it will be included in hidden calculations elsewhere. Blanks will not be overridden by this default number, so change these to “0” to be updated in bulk.
After you’ve entered your data, click on the black button to start getting insights.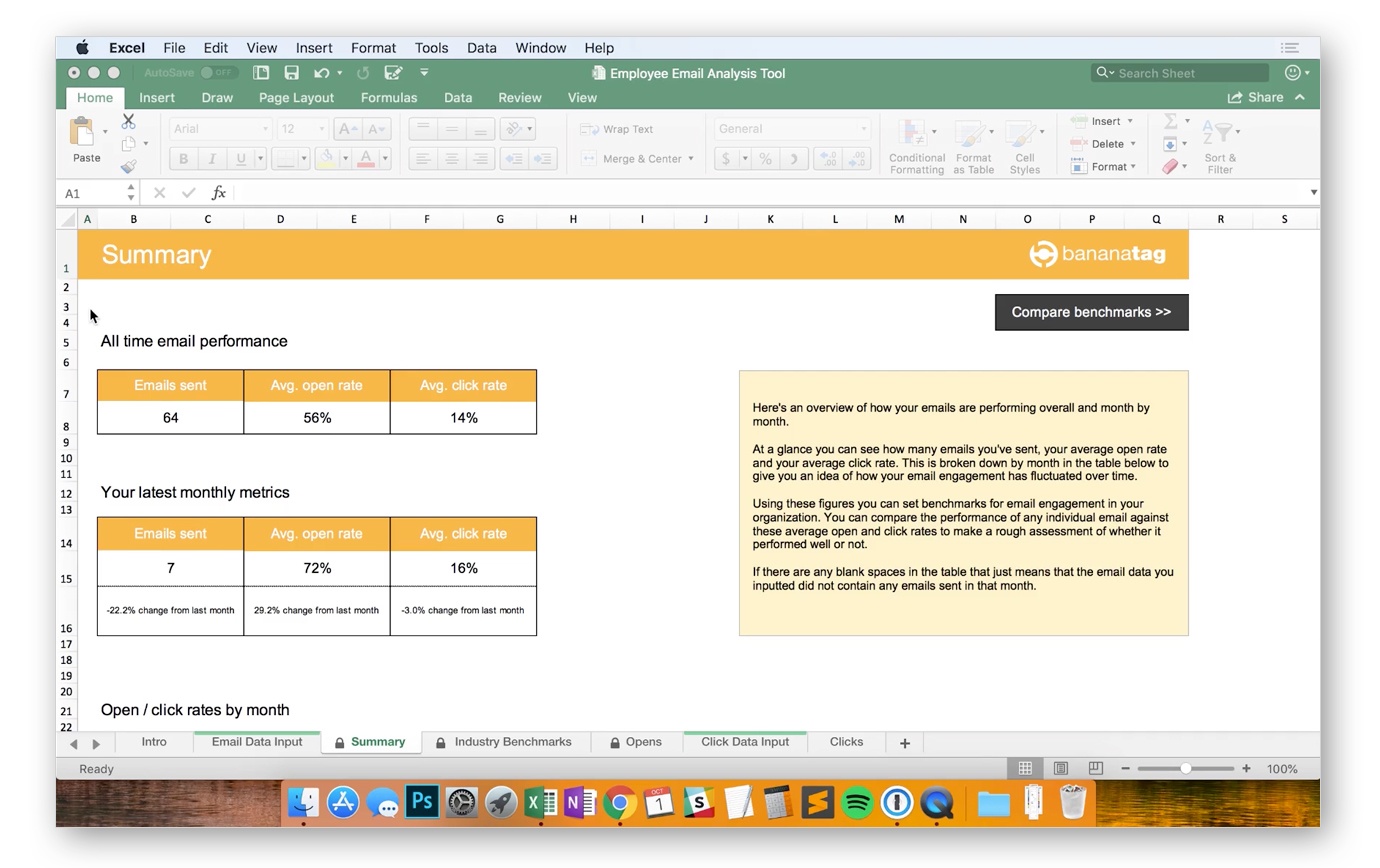
Analyzing your email data with the tool
The summary sheet gives an overview of your all-time email performance, which can be used to set overall benchmarks for email engagement.
It also tracks email sends, open rate, and click rate for the latest month (that’s the latest month you provided email data for).
In the visualization below, you can see how your open and click rates have changed over time, and pick out peaks that indicate success or dips that might suggest problems.
Months will be empty if the data you entered does not contain an email sent in that month.
Now that you have a benchmark of your own internal email performance and how it changes over time, you might be interested in how it compares to other organizations working in your industry.
Click the button to continue.
Comparing your employee email data to industry benchmarks
It’s time to compare your average email open and click rates (that’s your all-time figures) against industry averages.
Simply select your industry from the drop-down menu and this will update the comparison in the table below.
The analysis below will change depending on if you’re above or below industry averages.
These benchmarks are based on our own analysis of emails to over 46 million recipients, but please bear in mind that these are only averages and they aren’t a foolproof measure of good or bad performance.
Every company operates differently and has a different email culture. So while you can use these comparisons as a point of interest, don’t worry if your open and click rates seem low.
The most important benchmark will always be your own. See what your own averages open and click rates are, then aim to improve them.
Let’s start by looking at insights that will help us improve our open rates.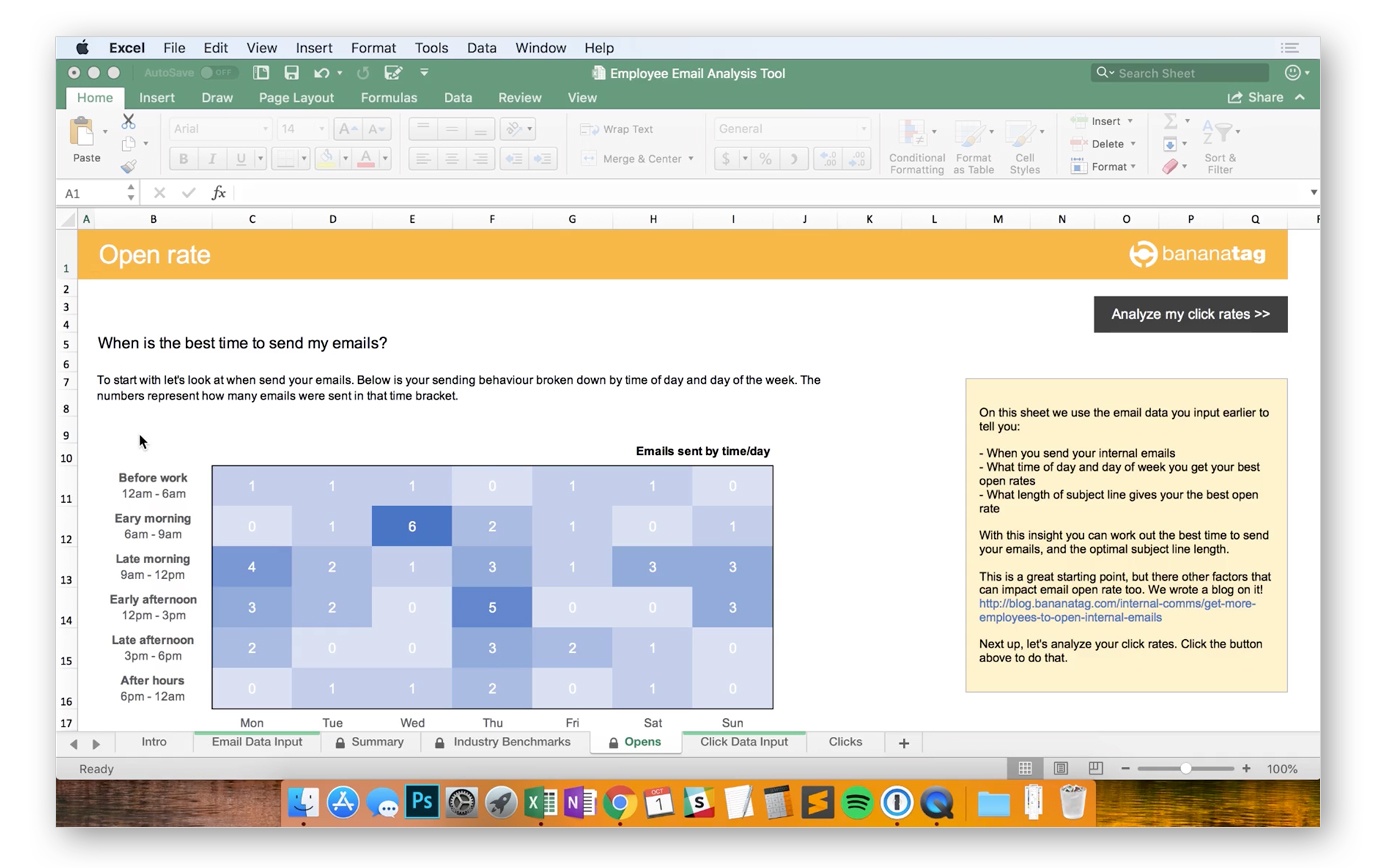
These benchmarks are based on our own analysis of emails to over 46 million recipients, but please bear in mind that these are only averages and they aren’t an unimpeachable measure of good or bad performance.
Every company operates differently and has a distinct email culture. So while you can use these comparisons as a point of interest, don’t worry if your open and click rates seem low.
The most important benchmark will always be your own. See what your own average open and click rates are, then aim to improve them.
Finding the best time to send employee emails
In the tool, the first table you’ll see tells you exactly how many emails you’ve sent in each time slot throughout the week. You might be surprised by how concentrated your email sends are.
The next table tells your average open rate in the same time slots. This can help you pick out the best time to send to maximize engagement.
By combining these two tables, you can find hot spots for email engagement, as well as gaps and opportunities.
You could aim to send your emails when you typically get best engagement, or try experimenting in slots you’ve never sent in to see if there are better times and days to be sending.
The more data you input into the report, the more accurate and insightful these reports will be.
Troubleshooting employee email data visualizations
If you get all zeros in the first table, it’s probably because your email data doesn’t include recipient numbers.
If the second table (the one with open rates) says 1% across the board, then you probably don’t have your open rate data in the correct format. Go back and fix that, and the table should work as expected.
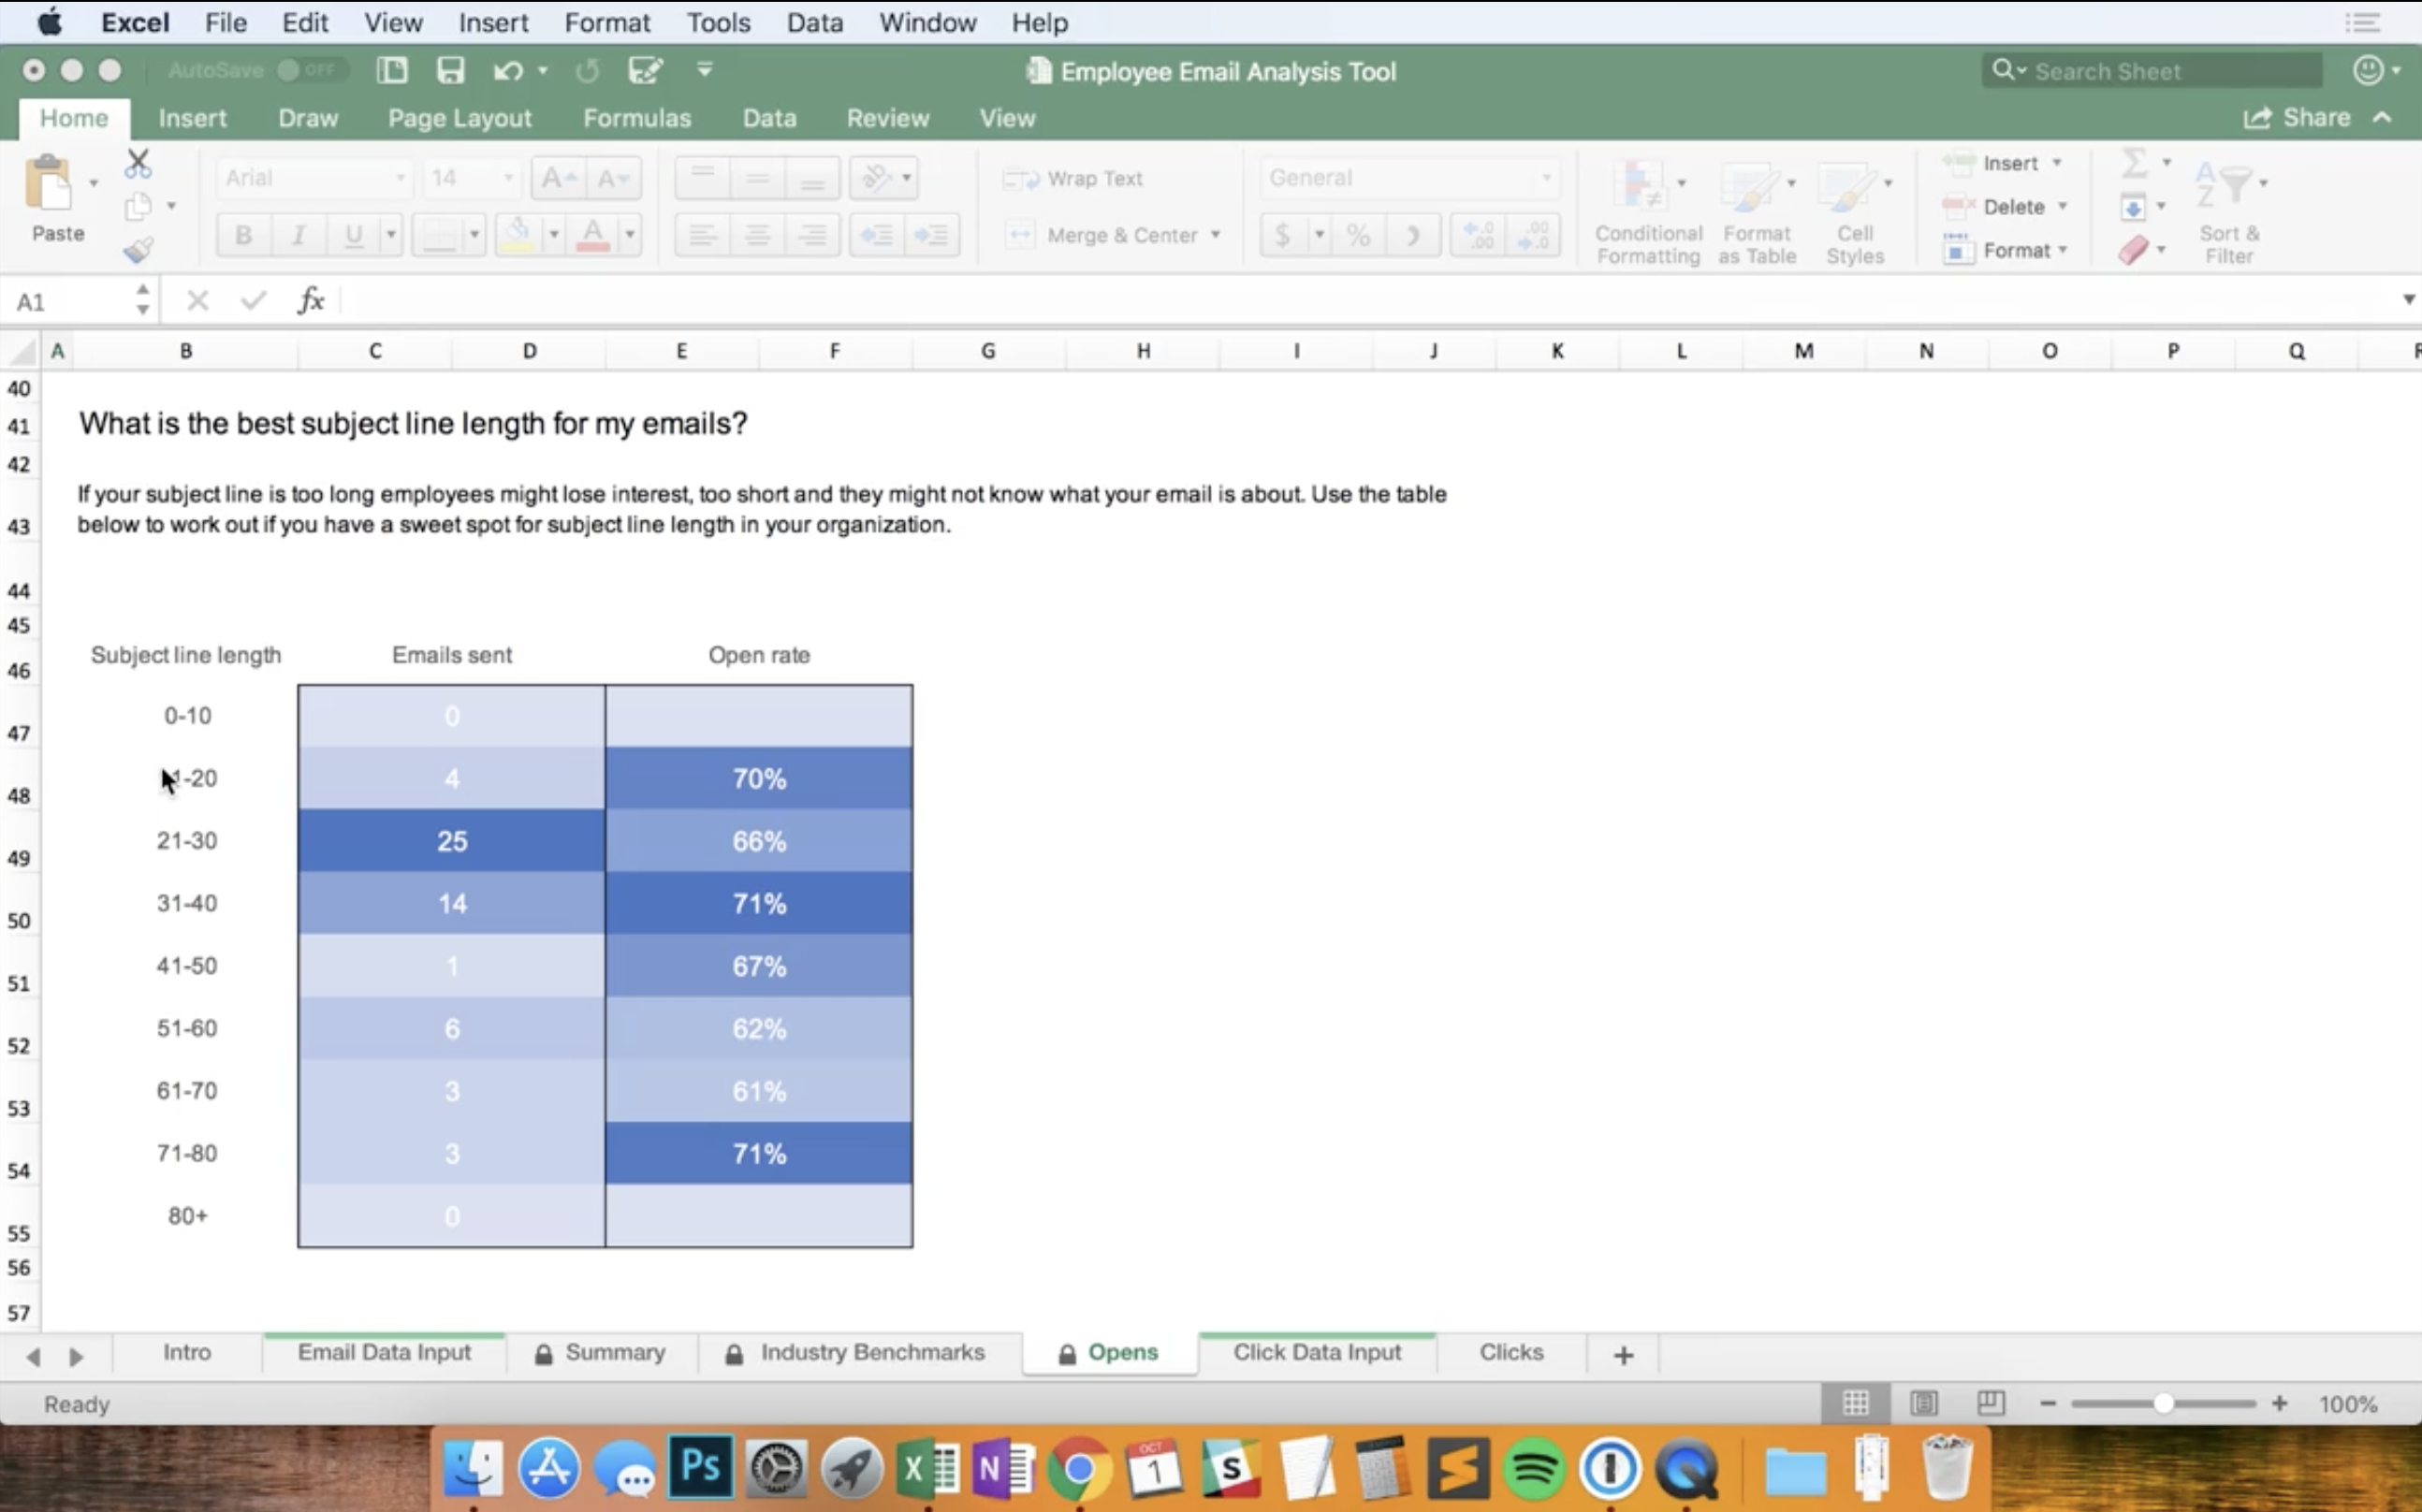
In the final visualization, we look at how the length of your subject lines affects your open rates. Subject line length is by character.
Again, use this to identify any sweet spots for subject line length so you can see what employees respond best to.
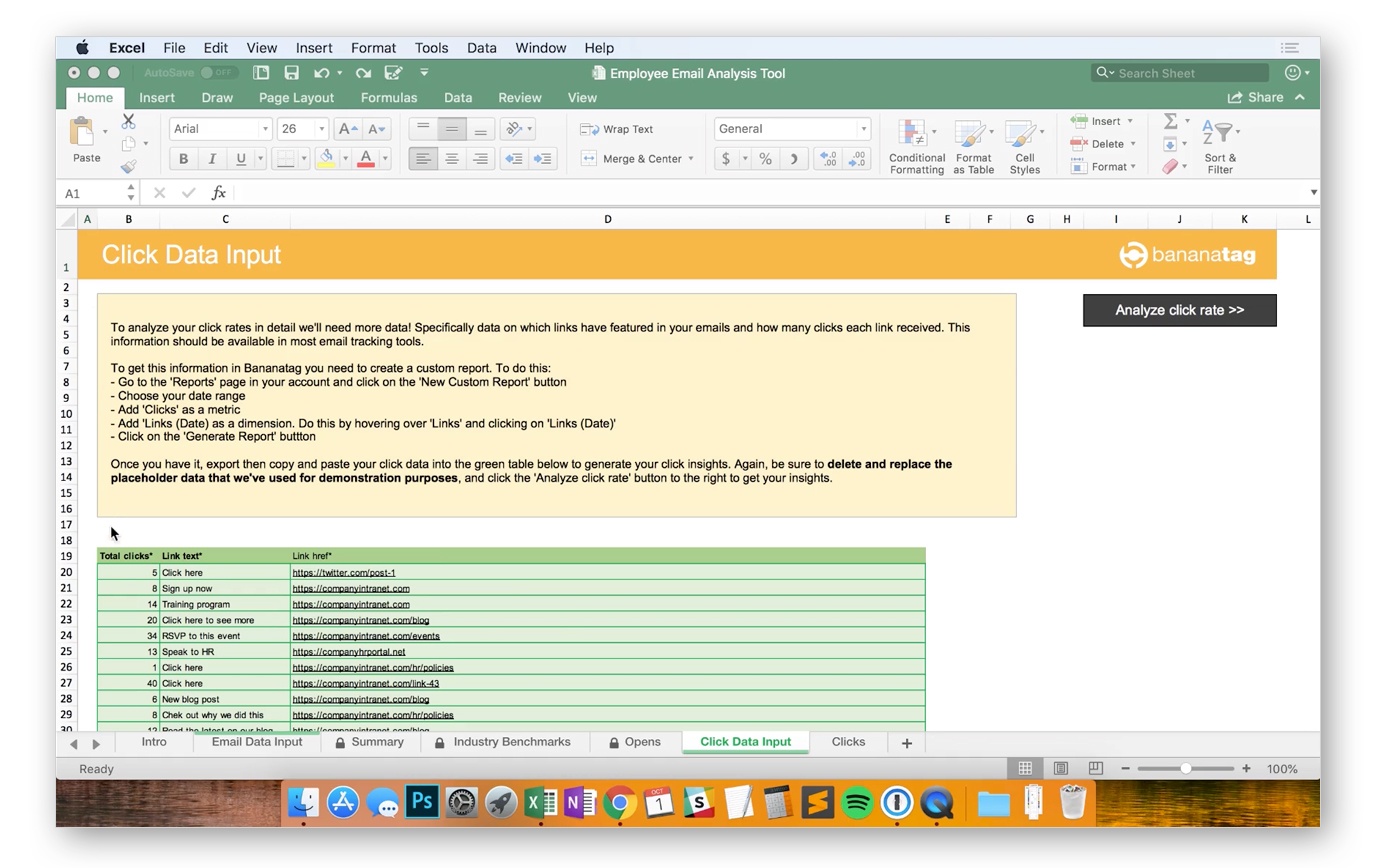
Analyzing employee email click rates
To properly analyze click rates, we’ll need more data.
As you did before, copy and paste the relevant data into the green table below. For click rate analysis we need: data on the number of clicks, the link text used, and the link target.
In Staffbase’s email designer, this can be exported via a custom report — details of that are included on this page.
So, like before, delete the placeholder information first, then copy and paste your data from your exported CSV.
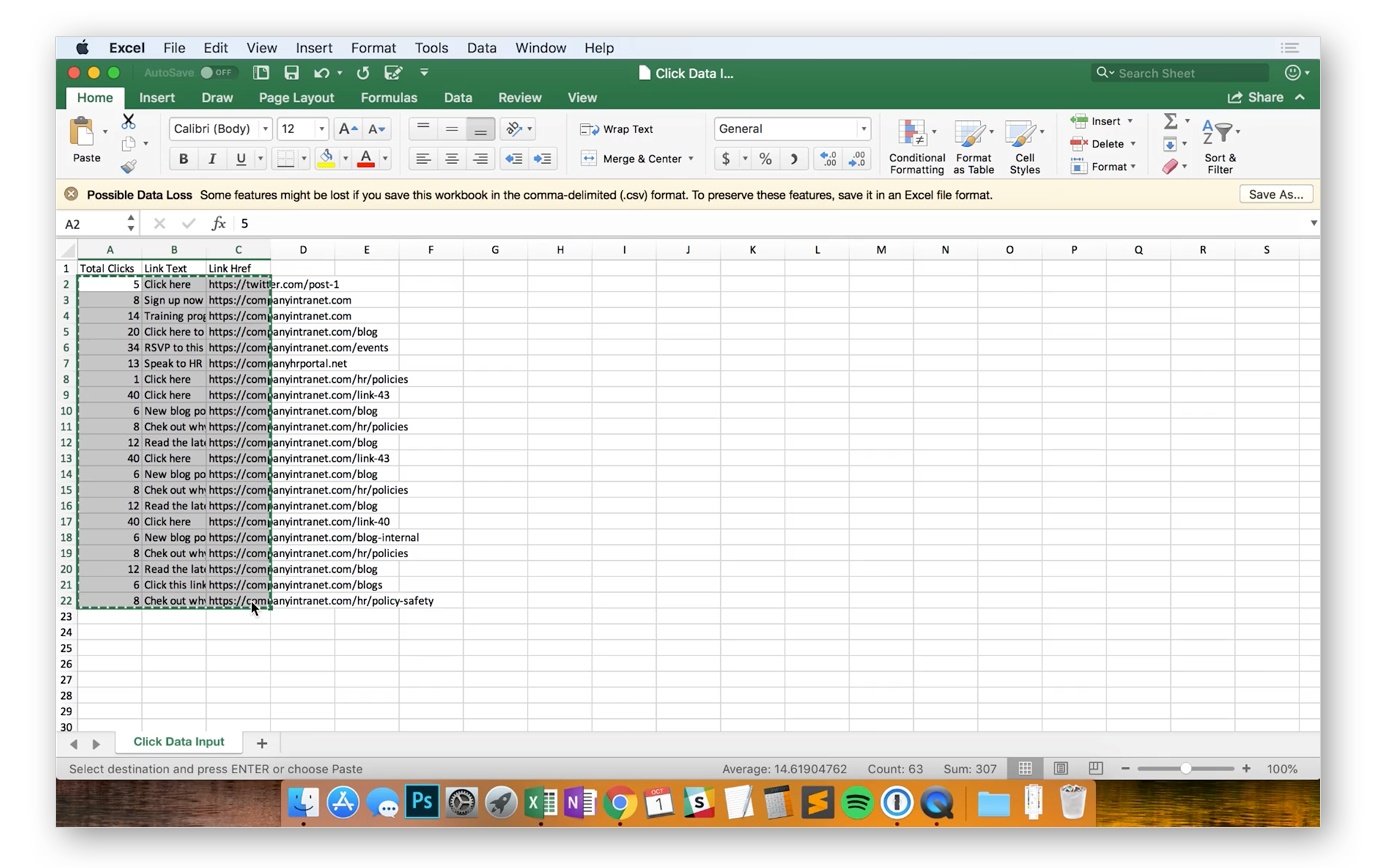
One thing to note: the calculations in this part of the tool can be quite slow if you’re inputting a lot of data. You’ll see a progress bar at the bottom of the Excel window, so just be patient and it’ll eventually work everything out.
Once the calculations are complete, you can click through to see some insights.
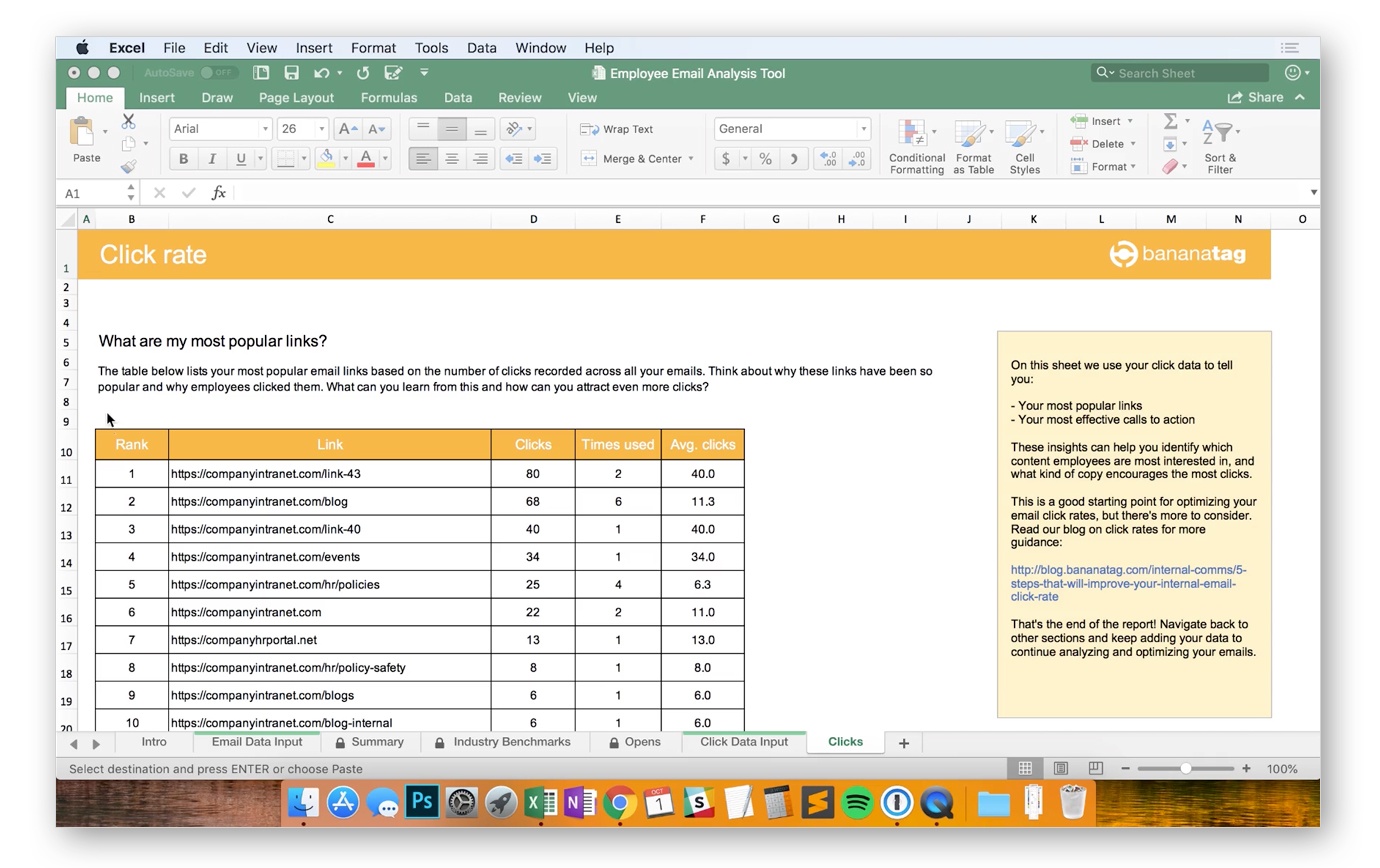
On this page, we use the click data you just entered to tell you your most popular links and most effective calls-to-action across all emails.
The top table gives you your top ten links, ranked by how many times they’ve been clicked.
There’s also information on how many times each link has been used, so you can work out the average number of clicks per use. That will help give context to your overall click numbers.
This table can help you work out which content and links employees are most interested in. It can also reveal how frequently you’re linking to the same content.
The second table outlines your ten most popular calls-to-action (CTAs), ranked by total clicks. By CTA, we mean the text you attached to links to in your emails. For instance, “click here” and “read more” are very common calls-to-action.
Again, we also have information on how often each call-to-action has been used, so you can work out the relative performance of your link text.
And that’s the end of the report!
You can use the navigation buttons to return to previous pages in the spreadsheet, or you can navigate using the tabs at the bottom.
If you’re having any problems with the report, please remember that it’s designed for data to be input in a specific format. So if you do have any issues it’ll probably be due to an issue in the data input stages.
In the meantime, happy number crunching!